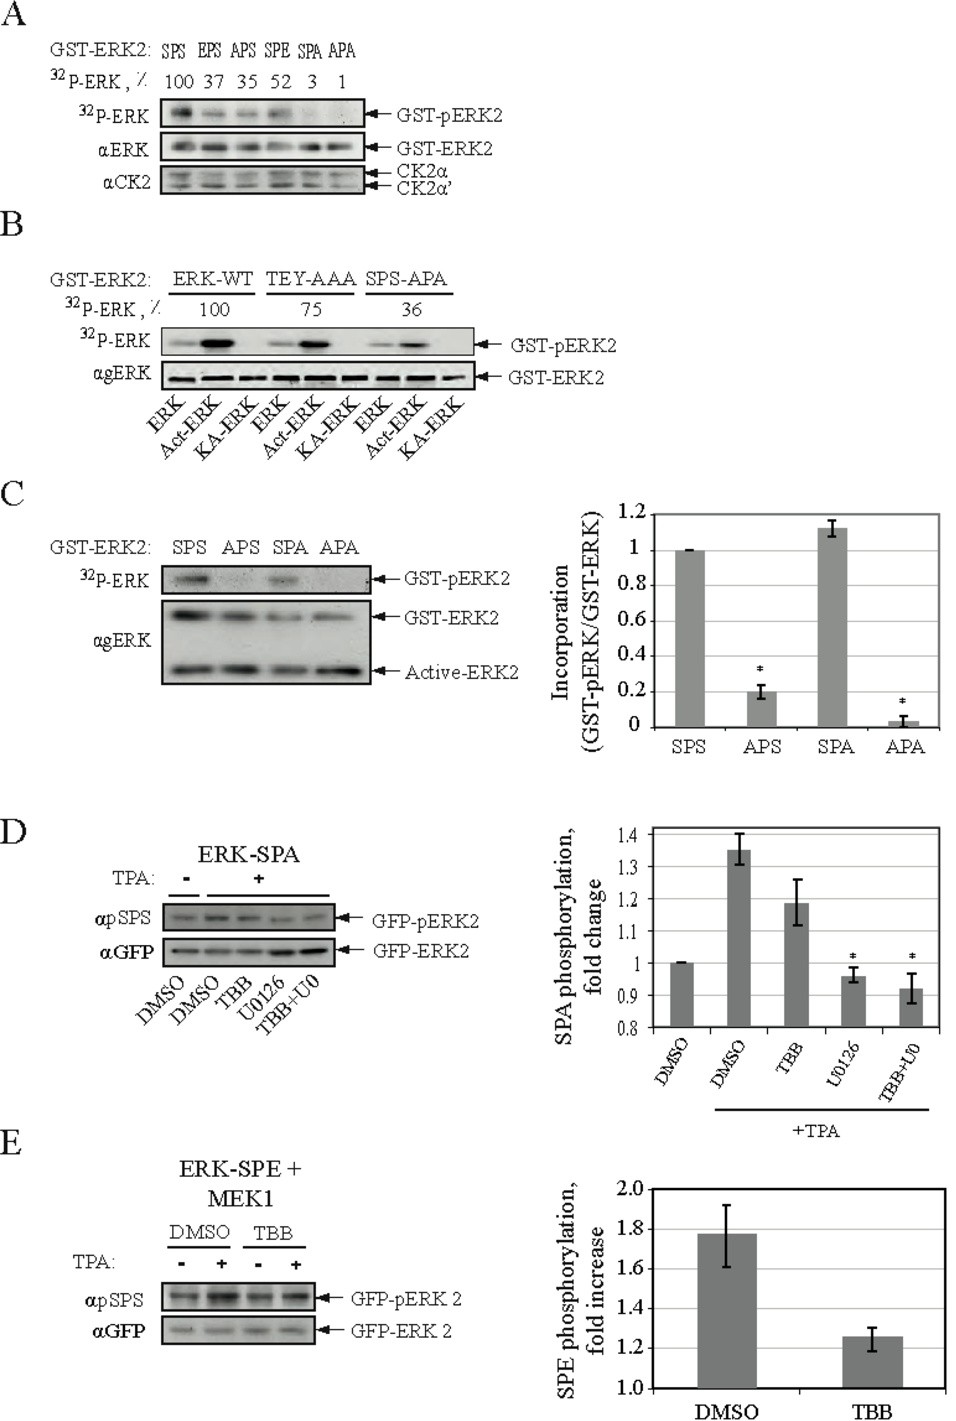
Fig. 7. CK2 phosphorylates both Ser244 and Ser246, while ERK participates in Ser244 phosphorylation. (A) CK2 phosphorylates both Ser244 and Ser246 in-vitro. The indicated GST-ERK2 constructs (0.1mg per sample) were subjected to an in-vitro CK2 phosphorylation as described. The phosphorylated proteins were detected by autoradiography, and band intensities were quantified by densitometry. The substrates and kinase were detected using the appropriate Abs. (B) ERK phosphorylates ERK's NTS in-vitro. The GST constructs ERK2-WT, ERK2-TEY-AAA or ERK-APA (SPS-APA) were subjected to in vitro phosphorylation with either GST-ERK2 (ERK), active GST-ERK2 (Act-ERK) or kinase dead GST-ERK2 (KA-ERK). The phosphorylation was detected by autoradiography. Amount of ERK was detected using agERK Ab. The intensity of the phosphorylation (percent of ERK-WT is shown on top of upper blot) was quantified by densitometry. (C) ERK phosphorylates Ser244 in vitro. The indicated GST-ERK2 constructs (0.1mg per sample) were subjected to in-vitro phosphorylation with ERK2. The amounts of phosphorylated constructs were detected by autoradiography, and that of the GST and endogenous kinase were detected by Western blot analysis using agERK Ab. The bar-graph represents the incorporation of 32p into GST-ERK as quantified by densitometry, (* p<0.05). (D) ERK phosphorylates Ser244 in-vivo. HEK-293T cells were transfected with GFP-ERK2-SPA, serum starved and pretreated with DMSO (control), TBB (10mM), U0126 (5mM) or both inhibitors for 2 h. Then the cells were stimulated with TPA (250nM, 10 min) or left untreated. pSer244 was detected using polyclonal apSPS Ab, and the amount of ERK was detected by aGFP Ab. The bar-graph represents SPA phosphorylation quantified by densitometry, (* p< 0.05). (E) Phosphorylation of Ser244 in-vivo is mediated mostly by CK2. HEK-293T cells were co-transfected with GFP-ERK2-SPE and RFP-MEK1, pretreated with TBB (10mM) or DMSO control for 2 h, and stimulated with TPA (250 nM, 15 min). pSer244 was detected as above, and quantified by densitometry (bar-graph, * p< 0.05).